Nuclear power is undergoing a major global revival. As nations seek carbon-free electricity, energy independence, and grid stability, major nuclear energy-producing countries are expanding their fleets, extending reactor lifespans, and deploying next-generation Small Modular Reactors (SMRs).
The United States leads the world in total nuclear electricity generation, followed by China and France. Together, civil nuclear reactors across 31 nations generate roughly 9% of the world’s electricity and account for over 20% of all low-carbon energy production. This complete guide outlines the top nuclear power producers using verified figures from the International Atomic Energy Agency (IAEA) Power Reactor Information System (PRIS) and the World Nuclear Association.
Which Country Produces the Most Nuclear Energy?
The United States produces more nuclear energy than any other nation. Its 94 commercial reactors generated 785.6 terawatt-hours (TWh) of electricity in 2025, accounting for nearly 29% of all nuclear electricity produced worldwide.
China ranks second in total output at 448.4 TWh and is expanding its nuclear capacity faster than any other country. France ranks third in raw generation with 373.5 TWh, but it relies on nuclear power more than any other major economy, deriving 68.1% of its total domestic electricity from nuclear reactors.
Global Snapshot of Nuclear Power in 2026
According to data compiled from IAEA PRIS and the World Nuclear Association, the global nuclear sector displays the following operational metrics:
- Operable Reactors Worldwide: 441 units
- Total Operating Capacity: ~404 gigawatts (GW)
- Reactors Under Construction: 79 units (representing ~85.8 GW of capacity)
- Countries with Active Reactors: 31 nations
- Global Electricity Share: ~9% of worldwide generation
New construction remains heavily concentrated in Asia, particularly in China and India, while several emerging nuclear energy-producing countries are pursuing their first commercial power projects. Meanwhile, North American and European operators maintain high output through power uprates, capacity improvements, and extended 80-year operating licenses.
Top Nuclear Energy-Producing Countries: Latest Complete Annual Data
Methodology & Data Consistency
Comparing top nuclear energy-producing countries requires analyzing total annual electricity generation measured in terawatt-hours (TWh). Because full calendar year totals for 2026 are still accumulating, 2025 serves as the latest complete annual benchmark recorded by IAEA PRIS. Operational reactor counts and construction statuses reflect verified records as of mid-2026.
| Rank | Country | 2025 Generation (TWh) | Domestic Nuclear Share (%) | Operable Reactors | Reactors Under Construction |
| 1 | United States | 785.6 | 17.7% | 94 | 0 |
| 2 | China | 448.4 | 5.0% | 56 | 37 |
| 3 | France | 373.5 | 68.1% | 57 | 0 |
| 4 | Russia | 204.9 | 18.7% | 34 | 3 |
| 5 | South Korea | 175.6 | 31.0% | 26 | 4 |
| 6 | Japan | 94.7 | 9.4% | 33 (14 active) | 2 |
| 7 | Canada | 81.1 | 13.0% | 17 | 1 |
| 8 | Spain | 51.5 | 18.9% | 7 | 0 |
| 9 | India | 49.1 | 3.2% | 24 | 8 |
| 10 | Sweden | 44.8 | 26.7% | 6 | 0 |
Data Note: Generation figures come directly from IAEA PRIS country records. Domestic nuclear share reflects annual electricity mix analysis compiled by the World Nuclear Association. Japan’s reactor tally includes 14 active units currently generating power out of a broader 33-unit licensed fleet working through safety restart approvals.
What the Nuclear Production Ranking Measures
Evaluating nuclear power by country requires distinguishing between four distinct metrics across leading nuclear energy-producing countries:
- Terawatt-hours (TWh) Generated: The actual amount of electricity produced by a country’s reactors in a full year. This serves as the objective standard for ranking national output.
- Nuclear Share (%): The percentage of a nation’s total domestic electricity derived from nuclear energy. Smaller countries can have a high nuclear share despite lower total output.
- Installed Capacity (GW): The maximum electrical power output if all reactors operate continuously at full capacity.
- Reactor Count: The total number of individual commercial reactors in service. Large modern reactors can outproduce fleets composed of smaller, older units.
Top Nuclear Energy Producers: Country-by-Country
United States
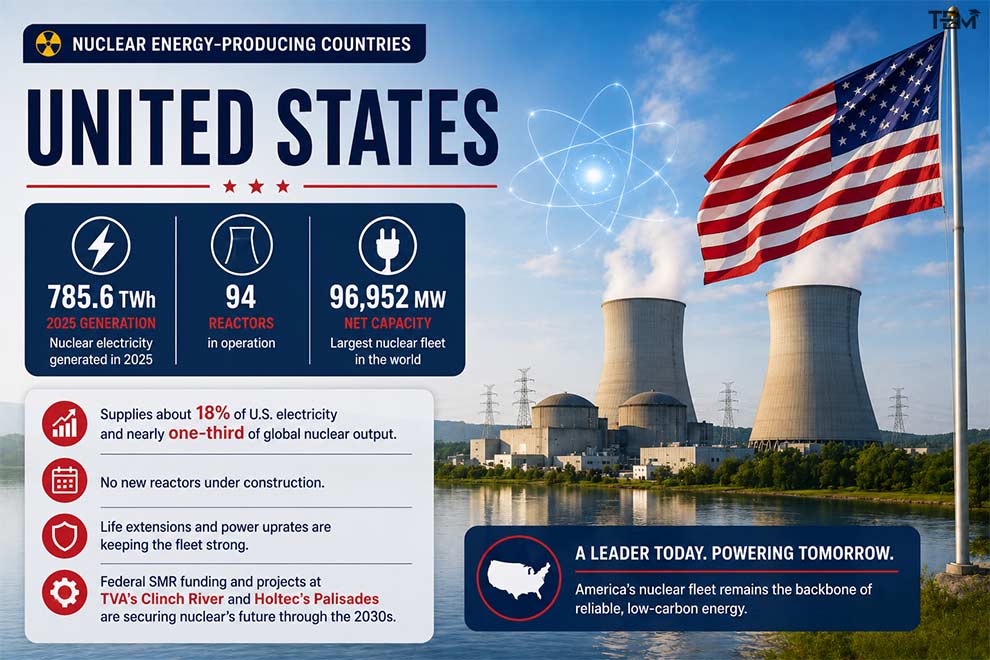
2025 Generation: 785.6 TWh
- Fleet Status: 94 operable reactors (96,952 MW net capacity)
Role & Outlook: The United States generates nearly a third of all nuclear electricity on Earth, making it the top performer among nuclear energy-producing countries. Although no gigawatt-scale reactors are currently under construction, federal funding, tax incentives, and life extension approvals are keeping existing plants operating for up to 80 years. SMR demonstration projects, including efforts by Holtec at Palisades and TVA at Clinch River, highlight the U.S. transition toward flexible nuclear tech.
China
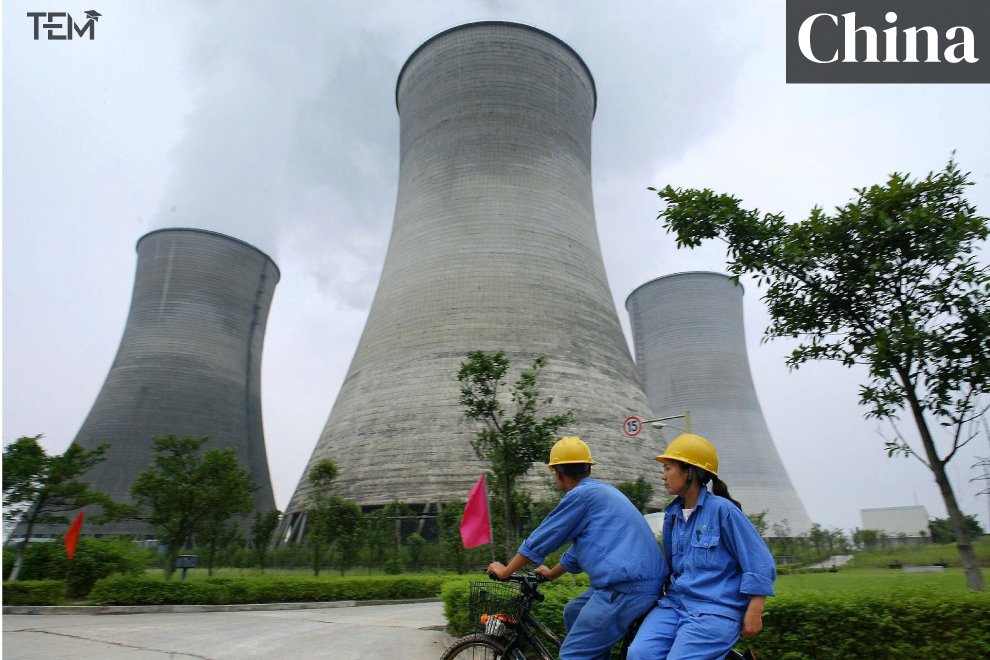
2025 Generation: 448.4 TWh
- Fleet Status: 56 operable reactors; 37 reactors under construction
- Role & Outlook: China is executing the fastest expansion among all nuclear energy-producing countries. Accounting for roughly half of all reactors under construction globally, China continuously connects new units to its grid, such as Sanao-1 and Taipingling-1 in early 2026. The nation aims to reach 100 GW of installed nuclear capacity around 2030.
France

2025 Generation: 373.5 TWh
- Fleet Status: 57 operable reactors (63,000 MW net capacity)
Role & Outlook: France operates the most nuclear-dense grid of any major economy, deriving over two-thirds of its electricity from nuclear power. With the Flamanville-3 EPR reactor entering commercial service, France relies on its standardized fleet for baseline power while exporting clean electricity across Western Europe.
Russia

2025 Generation: 204.9 TWh
- Fleet Status: 34 operable reactors; 3 reactors under construction
Role & Outlook: Russia supplies nearly a fifth of its domestic electricity through nuclear energy. Domestic expansion continues at sites like Kursk II and Leningrad II. Russia remains a significant global exporter of nuclear engineering, floating nuclear plants, and reactor fuel assemblies.
South Korea
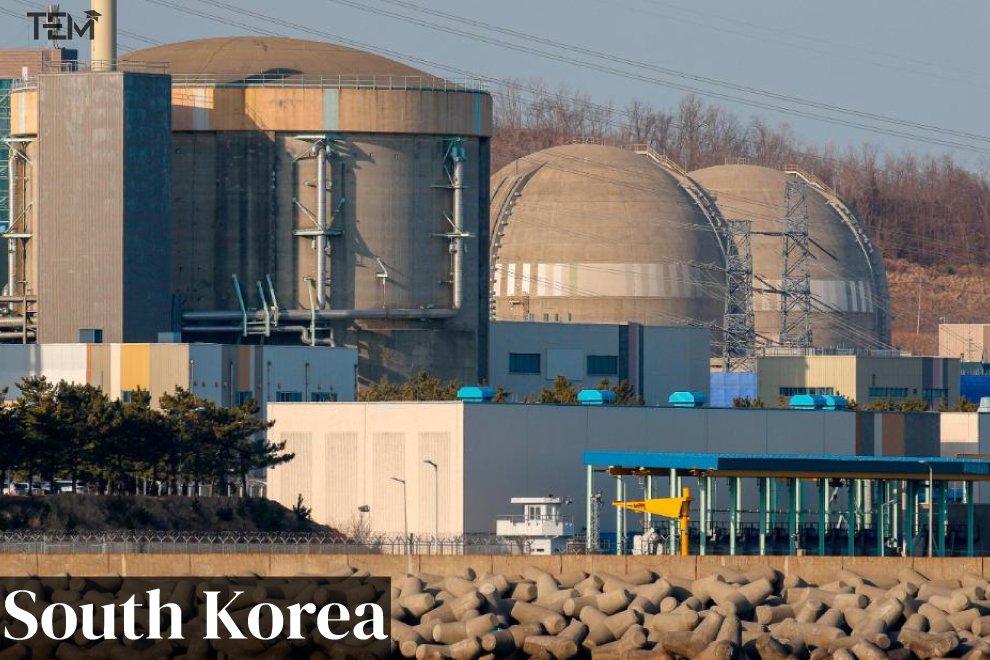
2025 Generation: 175.6 TWh
- Fleet Status: 26 operable reactors; 4 reactors under construction
Role & Outlook: South Korea powers its heavy industrial base with nuclear energy, which provides 31% of its national grid power. Construction on Shin-Hanul-4 broke ground in May 2026, joining Shin-Hanul-3 as part of South Korea’s plan to boost domestic clean energy and export its APR-1400 reactor technology.
Japan
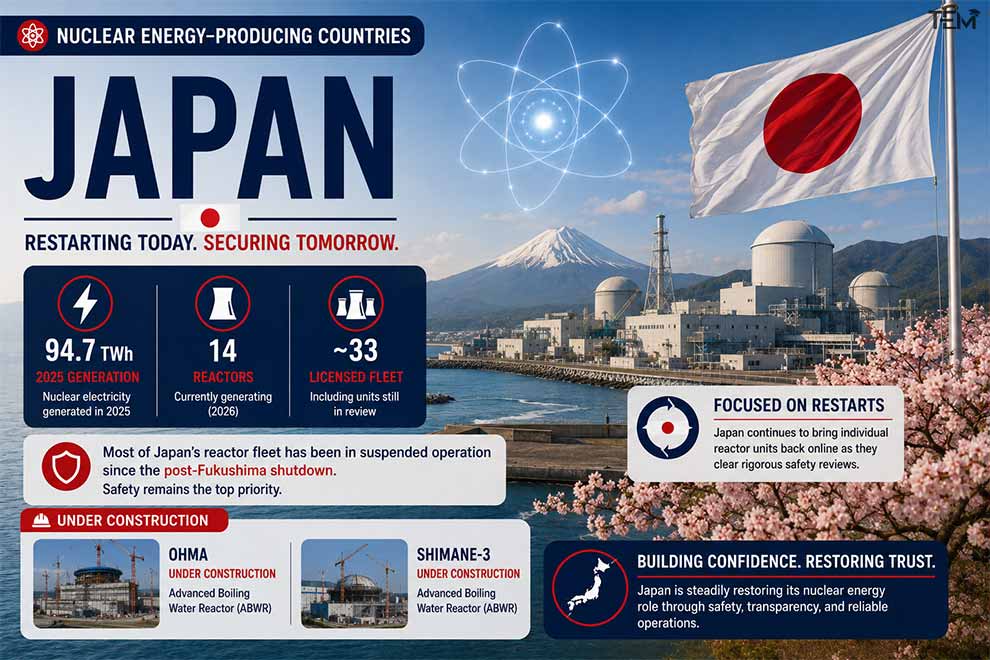
2025 Generation: 94.7 TWh
- Fleet Status: 33 licensed reactors (14 actively generating); 2 under construction
Role & Outlook: Japan’s nuclear trajectory focuses on post-Fukushima reactor restarts. As additional units clear rigorous safety reviews, Japan is gradually restoring nuclear power’s role in its national energy mix. Construction also progresses on new units at Ohma and Shimane-3.
Canada

2025 Generation: 81.1 TWh
- Fleet Status: 17 CANDU pressurized heavy-water reactors (12,714 MW capacity)
Role & Outlook: Canada relies on homegrown CANDU technology, which runs on natural uranium. In April 2026, Canada achieved a milestone by breaking ground on Darlington SMR1, a 300 MW small modular reactor representing one of the first commercial SMR construction starts among G7 nations.
Spain

2025 Generation: 51.5 TWh
- Fleet Status: 7 operable reactors (7,123 MW capacity)
Role & Outlook: Nuclear energy remains Spain’s single largest source of low-carbon electricity, supplying nearly 19% of the national total. Although official policy outlines a gradual fleet phase-out by 2035, energy reliability discussions continue to influence long-term operational schedules.
India
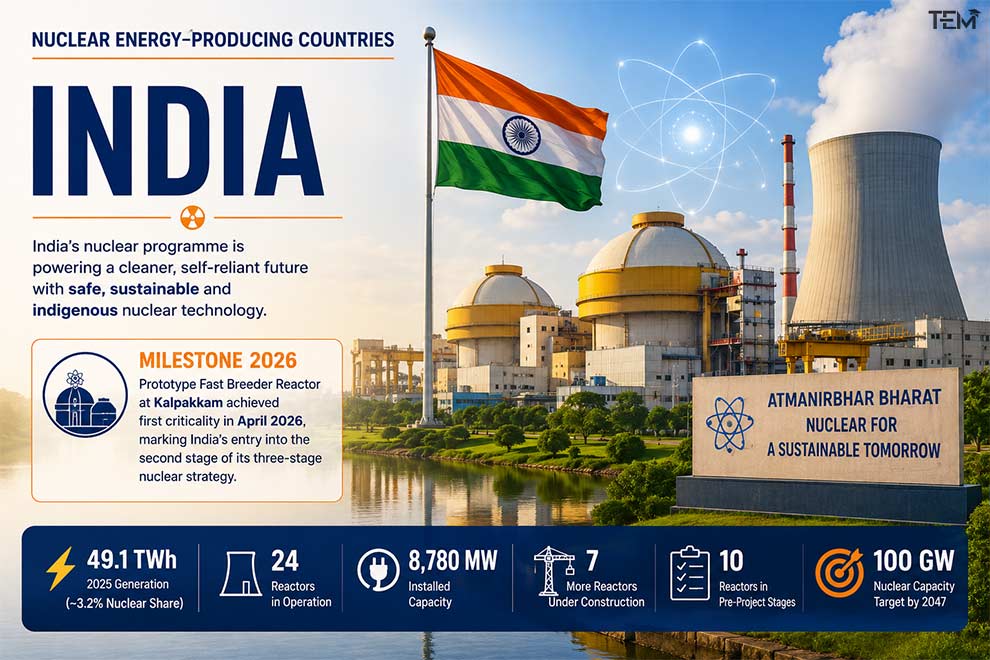
2025 Generation: 49.1 TWh
- Fleet Status: 24 operable reactors; 8 reactors under construction
Role & Outlook: India reached a pivotal technology goal in April 2026 when the Prototype Fast Breeder Reactor (PFBR) at Kalpakkam achieved first criticality. This milestone advances India’s three-stage nuclear energy program as the country works toward an ambitious target of 100 GW nuclear capacity by 2047.
Sweden
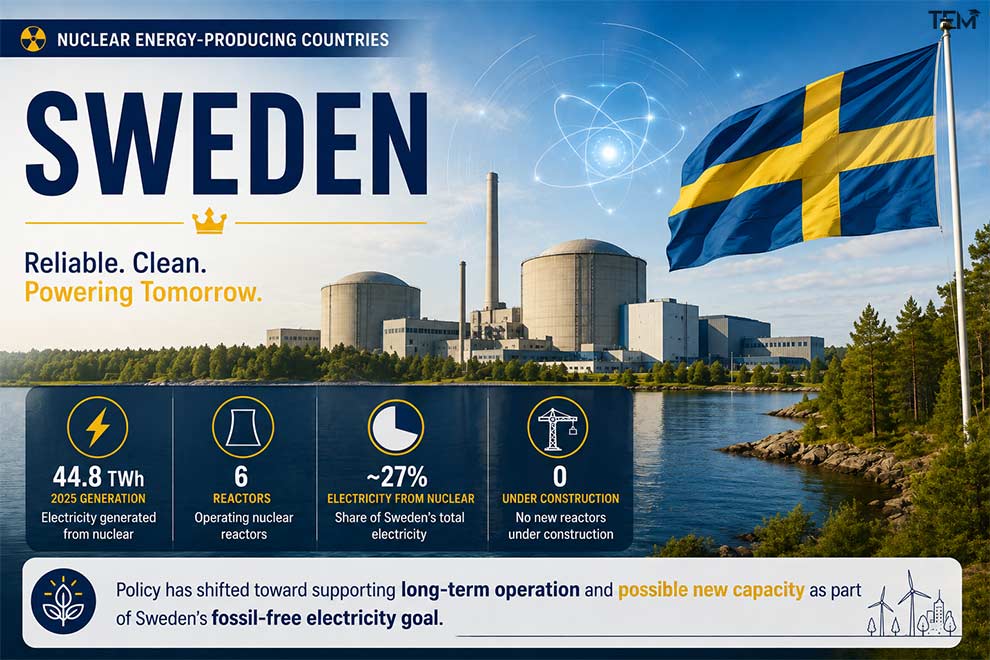
- 2025 Generation: 44.8 TWh
- Fleet Status: 6 operable reactors
- Role & Outlook: Sweden generates almost 27% of its electricity from six commercial reactors. National policy has shifted to support lifetime extensions and new nuclear buildouts to fulfill fossil-free electricity objectives.
Ukraine: Why Its Nuclear Data Requires Caution
Ukraine operates 15 nuclear reactors, and nuclear power historically supplied about half of its national electricity. World Nuclear Association estimates place Ukraine’s 2025 production at approximately 50.2 TWh.
However, ongoing conflict has disrupted official data submission to international monitoring agencies. IAEA PRIS country logs currently lack verified, standardized 2025 annual reports comparable to other nations. Consequently, Ukraine is omitted from the main Top 10 ranking table until official reporting resumes.
Largest Nuclear Producers vs. Highest Nuclear Dependence
A nation can generate large volumes of nuclear power while deriving only a fraction of its grid power from reactors. Conversely, smaller nations can depend almost entirely on nuclear energy despite low national generation volumes.
| Country | 2025 Nuclear Output (Volume) | Domestic Nuclear Share (Dependence) |
| United States | 785.6 TWh | 17.7% |
| France | 373.5 TWh | 68.1% |
| Slovakia | 18.0 TWh | 64.4% |
| Ukraine (Est.) | ~50.2 TWh | ~52.0% |
| Hungary | 15.2 TWh | 45.2% |
| South Korea | 175.6 TWh | 31.0% |
| Canada | 81.1 TWh | 13.0% |
| Spain | 51.5 TWh | 18.9% |
| India | 49.1 TWh | 3.2% |
France occupies a unique position as both a top-three global producer by volume and the world’s most nuclear-dependent major economy.
What’s Changing in Nuclear Energy in 2026?
China
Nuclear construction and deployment milestones across major nuclear energy-producing countries in 2026 reflect clear strategic moves across key markets:
- China: IAEA PRIS recorded official grid connections for Sanao-1 in March 2026 and Taipingling-1 in February 2026, alongside new site pourings at Zhangzhou, Lufeng, and Xudapu.
- India: Milestone developments include the Kalpakkam fast breeder reactor achieving criticality in April 2026, grid synchronization at Rajasthan-7, and construction starts on Kaiga-5 and Kaiga-6.
- Canada: Darlington SMR1 officially began concrete construction in April 2026, moving grid-scale small modular reactors from paper designs into active construction.
- South Korea: Official construction began on Shin-Hanul-4 in May 2026, expanding the country’s domestic reactor fleet.
- Japan: Safety approvals continue to bring suspended reactors back online, restoring baseline low-carbon power across regional power grids.
Nuclear Energy Countries to Watch in 2026
Several prominent nuclear energy-producing countries warrant close attention in 2026 due to active project pipelines:
- China: Maintains the largest construction pipeline on Earth, connecting multi-gigawatt capacity to the grid every year.
- India: Rapidly advancing its indigenous closed fuel-cycle reactors and multi-unit construction projects.
- Canada: Leading Western nations in commercial SMR deployment at the industrial utility level.
- Japan: Serving as a primary swing factor for total Asian nuclear generation as additional reactors clear restart reviews.
- South Korea: Expanding large reactor builds while actively bidding APR-1400 and SMR designs in international export markets.
Conclusion
The top tier of nuclear energy-producing countries remains anchored by the United States, China, and France. However, regional dynamics are shifting rapidly beneath these top ranks. China and India continue to drive Asia’s unprecedented reactor buildout, Japan is reactivating its offline capacity, and Canada is proving the commercial feasibility of SMRs.
As global power grids require reliable, clean, round-the-clock power, nuclear energy will remain central to international energy policies. For further insights on how energy technology is creating new employment opportunities, explore our guide on green jobs or read our latest policy analysis in Environment Studies.
FAQs
- Which country has the most nuclear reactors?
The United States operates the highest number of nuclear reactors worldwide, with 94 units in service. China ranks second with 56 operable reactors and 37 additional units under active construction.
- How many nuclear reactors are operating worldwide right now?
There are 441 operable nuclear power reactors worldwide across 31 countries, with a collective net generating capacity of approximately 404 GW.
- Which country relies most on nuclear power for its electricity?
France relies on nuclear power more than any other major economy, obtaining 68.1% of its electricity from nuclear energy. Slovakia (64.4%) and Hungary (45.2%) also generate large portions of their power from nuclear plants.
- How much nuclear electricity does the world produce each year?
In 2025, commercial nuclear power plants generated approximately 2,667 TWh of electricity globally, supplying roughly 9% of total worldwide electrical demand.
- Which countries are building new nuclear reactors in 2026?
Approximately 15 countries are actively constructing nuclear power reactors. China leads with 37 reactors under construction, followed by India, Russia, South Korea, and Japan. Canada also initiated construction on its first grid-scale SMR unit in April 2026.