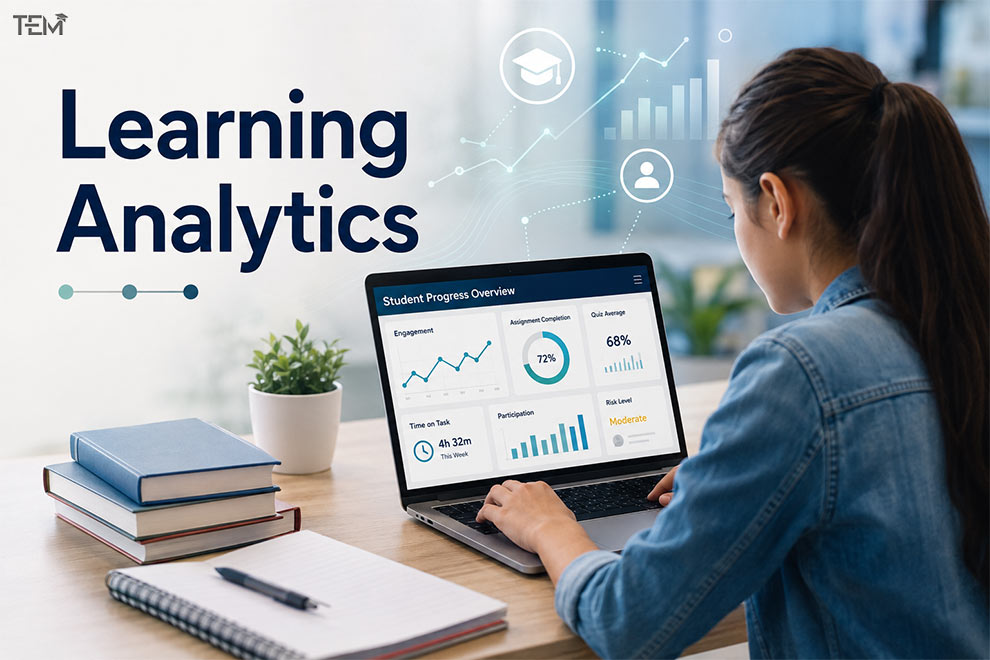
A student logs into a Learning Management System, watches part of a video lecture, misses an assignment deadline, scores low on a quiz, and stops participating in discussion forums. Viewed individually, each event looks like an isolated incident. When integrated into a unified digital ecosystem, learning analytics connects these behavioral traces to reveal where learning breaks down. Modern educational platforms capture thousands of interaction logs every day. The true objective of digital education is not simply collecting this information, but turning activity logs into actionable evidence that improves instruction and academic growth.
This guide explores how educational institutions use learning analytics, predictive tools, and teaching strategies to convert raw student data into better learning outcomes in 2026.
How We Researched Learning Analytics
To produce this guide, we evaluated foundational frameworks from established organizations, including the Society for Learning Analytics Research (SoLAR) and EDUCAUSE. We analyzed technical capabilities across major Learning Management Systems, reviewed vendor documentation, and evaluated how institutions apply descriptive, diagnostic, predictive, and prescriptive analytics models. Market statistics and demographic data were verified against primary research reports from Mordor Intelligence, Straits Research, Market Research Future, and the Pew Research Center.
What Is Learning Analytics?
Learning analytics uses student learning data, such as assessment results, course activity, attendance, and online interactions, to identify learning patterns and help educators make better instructional decisions.
The Society for Learning Analytics Research (SoLAR) defines the discipline as the measurement, collection, analysis, and reporting of data about learners and their contexts. Organizations such as EDUCAUSE, UNESCO, and the U.S. Department of Education emphasize that analytics provides crucial visibility into how students interact with course materials, peers, and instructors.
In simple terms: learning analytics gives teachers visibility into student progress so they can refine instruction and assist struggling learners before grades drop.
How Learning Analytics Works
Learning analytics turns raw digital traces into meaningful educational support through a continuous five-step operational cycle.
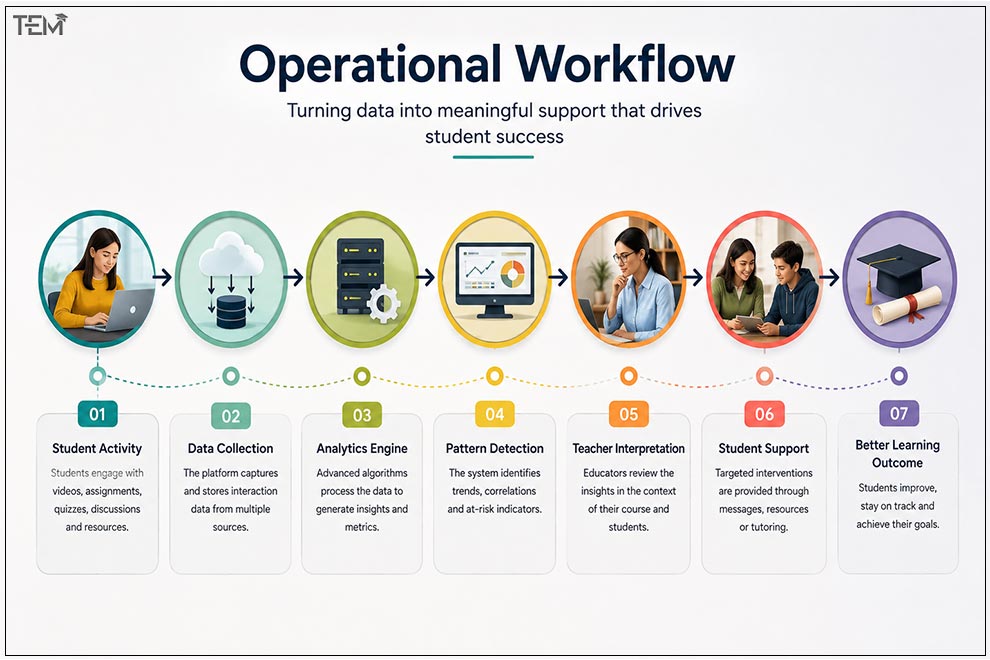
- Collect: Digital learning tools record student interactions, including login times, resource downloads, quiz scores, and discussion posts.
- Integrate: Centralized systems aggregate interaction logs from learning portals, student databases, and external tools into unified learner profiles.
- Analyze: Statistical models and algorithms process historical data to evaluate progress and highlight behavioral shifts.
- Interpret: Instructors and academic advisors evaluate automated indicators within the specific context of their course goals.
- Act: Educators deliver targeted assistance, such as adjusting upcoming lesson plans, sending guidance messages, or offering direct tutoring.
Analytics yields minimal educational value unless teachers interpret the signals and execute timely interventions.
What Data Does Learning Analytics Use?
Educational platforms evaluate multiple behavioral streams to construct accurate student progress profiles. Combining diverse data channels reduces diagnostic errors and improves support precision.
| Data Type | Specific Metrics Collected | Educational Purpose | Practical Output |
| Engagement Activity | Login frequency, session duration, portal access times | Measures student interaction consistency | Participation dashboards |
| Assessment Performance | Formative quiz results, question error rates, attempt counts | Pinpoints specific skill deficits and concept gaps | Diagnostic skill reports |
| Submission Pacing | Submission timing relative to deadlines, draft logs | Identifies time management issues and study strain | Workload risk flags |
| Attendance & Participation | Virtual class participation, video completion rates | Detects early disengagement and session drops | Attendance alerts |
| Social Collaboration | Forum post counts, reply thread depth, peer feedback | Evaluates peer collaboration and social learning | Collaboration scores |
| Resource Navigation | Video rewinds, page view frequency, search queries | Highlights confusing course content and resource flaws | Content revision maps |
How Learning Data Is Collected Beyond the LMS
Modern digital learning extends far beyond a standard Learning Management System. Institutions use open data standards like the Experience API (xAPI) and Caliper Analytics to capture student learning activities across external websites, mobile applications, virtual simulations, and eBook readers. These external interactions stream directly into a Learning Record Store (LRS). The LRS consolidates informal and experiential activity logs into a central repository, giving learning analytics platforms a complete view of student learning across all digital channels.
The Four Major Types of Learning Analytics
Educational systems implement four distinct analytical models, moving from historical summaries to automated action recommendations.
- Descriptive Analytics (What happened?): Evaluates historical records to summarize past events. Examples include class attendance summaries, assignment completion rates, and module score averages.
- Diagnostic Analytics (Why did it happen?): Compares relationships across datasets to uncover the causes of specific learning outcomes. For instance, it can reveal whether low exam scores correlate with skipped reading assignments.
- Predictive Analytics (What will happen next?): Uses statistical models to forecast future student outcomes based on historical patterns.
- Prescriptive Analytics (What action should be taken?): Recommends specific instructional steps to improve student success. Advanced platforms suggest supplementary readings, tailored practice problems, or advising check-ins based on predicted learning gaps.
| Analytics Model | Core Question Addressed | Primary Operational Focus | Practical Outcome |
| Descriptive | What happened in the course? | Historical activity tracking | Activity reports and dashboards |
| Diagnostic | Why did specific results occur? | Cause-and-effect analysis | Identification of learning bottlenecks |
| Predictive | What future outcomes are projected? | Trend forecasting and modeling | Early indicator alerts for faculty |
| Prescriptive | What specific action should be taken? | Decision guidance and recommendations | Tailored instructional strategies |
Examples of Learning Analytics in Education
Learning analytics takes many practical forms depending on who is using the data and what educational challenge needs solving.
- Early-Warning Risk Alerts: Automated flags notify advisors when a student drops below threshold levels in attendance, logins, or formative assignments.
- Course Engagement Dashboards: Visual portals allow instructors to see which lecture videos students rewatch most frequently, signaling complex topics that need re-teaching.
- Assessment Item Analytics: Statistical breakdowns highlight test questions that a majority of students answer incorrectly, helping teachers identify flawed questions or unaddressed concepts.
- Personalized Learning Recommendations: Adaptive tools suggest specific practice exercises based on a student’s previous incorrect responses.
- Curriculum Sequence Analytics: Academic departments analyze cross-course data to identify gateway courses with high failure rates, leading to revised prerequisite structures.
- Student Self-Reflection Dashboards: Student-facing interfaces display personal study time and assignment pacing compared to class averages, encouraging self-regulated learning.
Learning Analytics vs Academic Analytics vs Institutional Analytics
Data initiatives in education operate across different organizational levels. Distinguishing between these categories ensures proper alignment between data collection, analysis goals, and decision-makers.
| Analytics Category | Primary Level of Analysis | Primary Target Audience | Core Operational Purpose |
| Learning Analytics | Individual learner, course cohort, module interaction | Instructors, students, instructional designers | Enhances classroom teaching, feedback, and student learning |
| Academic Analytics | Academic program, department, degree track | Department chairs, curriculum committees, deans | Evaluates program efficiency, retention trends, and curriculum quality |
| Institutional Analytics | Enterprise operations, campus infrastructure | University executives, board members, policymakers | Guides resource allocation, financial planning, and enrollment policy |
Research from EDUCAUSE emphasizes that while academic and institutional analytics focus on operational performance, learning analytics centers directly on the interaction between teachers, learners, and educational content.
AI and Learning Analytics: What Changes in 2026?
Artificial intelligence enhances learning analytics by accelerating pattern identification across complex datasets. AI processes unstructured student text alongside traditional test scores, helping tools summarize discussion forum sentiment, evaluate essay drafts, and identify comprehension struggles faster.
Expert Insight: AI does not replace learning analytics. It changes how quickly institutions can interpret data and execute meaningful support.
| Capability Area | Traditional Learning Analytics | AI-Enhanced Learning Analytics |
| Data Processing | Focuses mainly on structured quantitative metrics | Processes structured and unstructured data formats |
| Pattern Detection | Relies on pre-set rules and manual queries | Surfaces complex behavioral trends automatically |
| User Interface | Presents static visual charts and dashboards | Delivers natural-language summaries and conversational insights |
| Intervention Planning | Requires manual identification of support steps | Generates automated recommendations for human review |
Major industry developments reflect this technological evolution in 2026:
- In April 2026, Google for Education updated Google Classroom analytics tools, adding detailed progress tracking, assignment completion projections, and AI-supported performance recommendations.
- In March 2026, leading EdTech providers embedded machine learning models into core Learning Management Systems to deliver automated pathway recommendations.
- Blackboard completed financial restructuring to operate debt-free, focusing capital investments on core teaching workflows and integrated AI analytics capabilities.
- Anthology introduced advanced AI features inside Blackboard, expanding data capture for student performance tracking.
- Rise Up acquired Domoscio to combine adaptive learning technology with performance analytics platforms.
While AI accelerates data processing, automated systems introduce risks regarding algorithmic bias, transparency, and data privacy. Responsible institutions mandate human review of AI recommendations to maintain instructional quality.
Early-Warning Systems and Predictive Retention
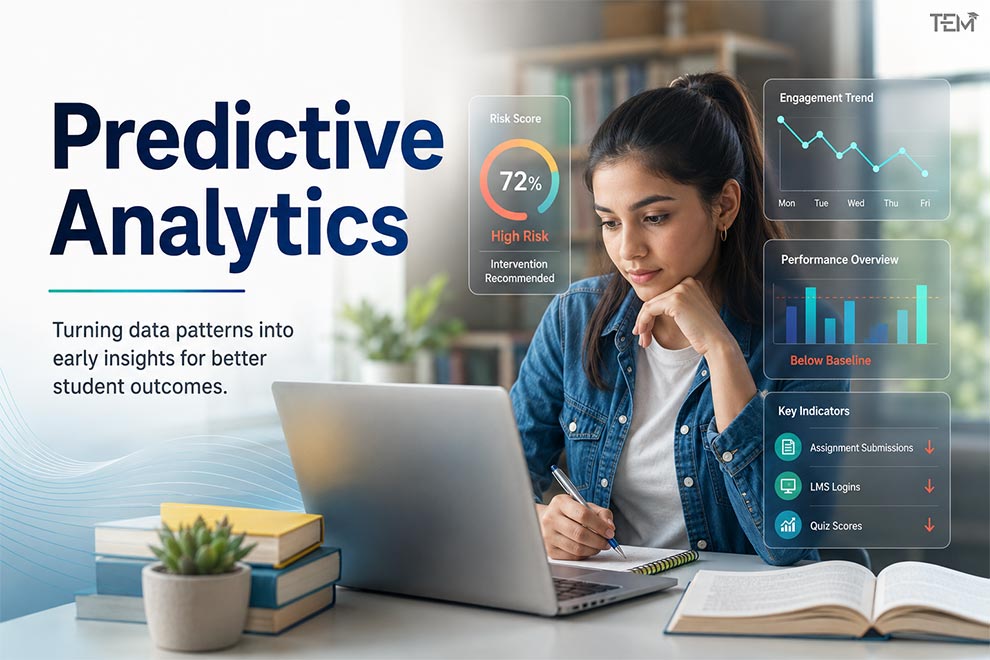
Early-warning systems analyze interaction metrics to highlight statistical patterns linked with academic difficulty. By tracking missed deadlines, falling quiz scores, lower portal activity, and attendance shifts, predictive platforms generate early flags for advising outreach.
Practical Insight: A high-risk score should trigger a conversation, not a conclusion.
Predictive models do not determine that a student is destined to fail. Instead, they signal that a student exhibits behaviors similar to past learners who struggled, giving educators an opportunity to offer proactive guidance. AI can automate parts of the early-warning workflow, but educators remain responsible for interpreting and acting on those signals.
Empowering Teachers and Personalizing Learning Pathways
Learning analytics replaces guesswork with empirical classroom evidence. Instructors use course metrics to evaluate module clarity, test fairness, and teaching pacing. When multiple students repeatedly rewatch a specific lecture segment or answer a quiz item incorrectly, the platform flags an instructional bottleneck. Educators can then clarify complex concepts, adjust upcoming lessons, or revise course materials.
Teaching Insight: The most useful analytics alert is not necessarily the most complex one. A simple missed-assignment signal can be more valuable than a complex prediction if it reaches the right teacher early enough to help.
Analytics also provides the diagnostic evidence needed for personalized learning pathways. Software identifies personal performance patterns and suggests targeted practice materials. However, a key distinction exists: learning analytics provides the evidence for personalization, while adaptive learning systems and teachers deliver the customized instruction.
Learning Analytics Market: What Is Driving Growth?
The global market for educational analytics tools is expanding rapidly due to measurable operational benefits and institutional retention mandates. Five primary factors drive market expansion across higher education and enterprise learning:
- Focus on Student Retention: Higher education institutions face enrollment pressures and tie financial viability to completion metrics, adopting analytics suites to flag struggling learners early.
- Legislative Accountability: Performance-based funding in 28 U.S. states links public university allocations directly to student success benchmarks, making analytics adoption operational policy.
- Cloud Platform Adoption: Cloud deployment lowers infrastructure costs, letting smaller institutions access enterprise analytics via subscription models.
- Integration with LMS Platforms: Seamless technical links between analytics platforms, Learning Management Systems, and Student Information Systems shorten setup times.
Key Market Statistics
- Global Market Expansion: According to market research from Mordor Intelligence, the global learning analytics market size is projected to grow from $14.05 billion in 2025 to $16.99 billion in 2026, reaching $43.87 billion by 2031 at a 20.90% CAGR.
- Education Analytics Segment: Industry figures from Straits Research show the education and learning analytics market reaching $15.98 billion in 2026, heading toward $55.73 billion by 2034 at a 16.90% CAGR.
- Predictive Analytics Leadership: Reports from Straits Research highlight that predictive analytics leads the solution segment, holding a 37.40% market share.
- Cloud Deployment Share: Data from Future Market Insights indicates that cloud-based deployments lead technology delivery with a 67% market share.
- Retention Impact: Research compiled by Market Research Future notes that institutions using data-informed retention strategies achieve up to a 20% improvement in retention rates and a 15% reduction in course dropouts.
Ethical Learning Analytics: Privacy, Bias, and Limitations
Deploying learning analytics introduces important ethical questions that institutions must manage responsibly. Continuous tracking of student clicks, portal logins, and access times risks creating surveillance concerns that undermine trust between learners and institutions. Machine learning models trained on historical data can replicate systemic biases, disproportionately tagging specific student demographics as at-risk. Inaccurate risk flags may misallocate academic counseling resources or discourage capable students.
Learning analytics pioneer George Siemens warned that while analytics provides valuable behavioral signals, technology cannot capture the softer elements of learning, such as encouraging words from a teacher or informal peer interactions. He emphasized that educators must ensure assessment targets do not replace true learning as the primary goal.
To safeguard student rights, systems must comply with privacy laws such as the Family Educational Rights and Privacy Act (FERPA) in the United States and the General Data Protection Regulation (GDPR) in Europe.
Data Governance Insight: Analytics should signal an issue, not define a student.
Future Trends in Learning Analytics (2026–2030)
Between 2026 and 2030, several emerging trends are likely to shape learning analytics, particularly privacy-preserving architectures, explainable AI, and learner-controlled data.
Research focuses increasingly on privacy-preserving synthetic learner datasets. These artificial datasets replicate real student behavior patterns without exposing personal identities, allowing developers to train predictive tools safely. Concurrently, analytics platforms are adopting Explainable AI standards to give teachers plain-language explanations for predictive risk flags. Future systems will also support student-owned data portfolios, enabling learners to transfer verified competency records across universities and employers.
Conclusion: Turning Learning Analytics Into Better Educational Outcomes
Learning analytics gives educational institutions unprecedented visibility into how students interact with course content, instructors, and digital tools. By converting digital activity logs into structured evidence, data platforms help educators deliver timely support, personalize instruction, and address learning struggles before they impact final grades.
However, technology delivers its greatest benefits when combined with thoughtful teaching. Data platforms highlight engagement patterns, but educators provide the personal encouragement and contextual understanding needed to guide students. As institutions expand their data capabilities through 2026 and beyond, prioritizing ethical governance, student privacy, and teacher involvement will ensure that learning analytics fulfills its promise to improve instruction and help every student succeed
FAQ
- What is learning analytics in modern education?
Learning analytics measures, collects, analyzes, and reports student interaction data from digital learning environments. Its goal is to help teachers understand student behaviors, refine course design, and provide timely academic support.
- What are the four main types of learning analytics?
The four types are descriptive analytics (what happened), diagnostic analytics (why it happened), predictive analytics (what will happen next), and prescriptive analytics (what specific action to take).
- How does learning analytics help identify struggling students?
Early-warning tools track activity changes, such as missed deadlines, lower quiz scores, decreased portal visits, and reduced discussion participation. When student metrics drop below established benchmarks, the platform alerts advisors to offer guidance.
- What is the difference between learning analytics and academic analytics?
Learning analytics focuses on individual students, course cohorts, and specific learning interactions to improve classroom teaching. Academic analytics evaluates department metrics, enrollment trends, and degree completion rates to guide institutional decisions.
- How is artificial intelligence used in learning analytics in 2026?
AI models analyze unstructured student text, generate automated formative feedback, dynamically adapt practice materials, and surface potential risk patterns directly within Learning Management Systems.