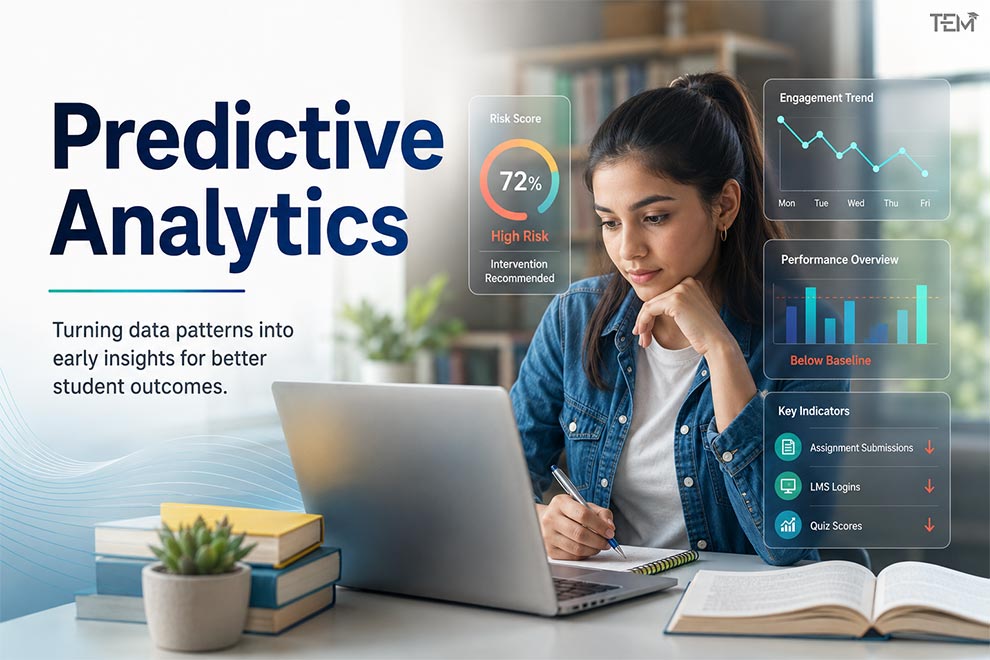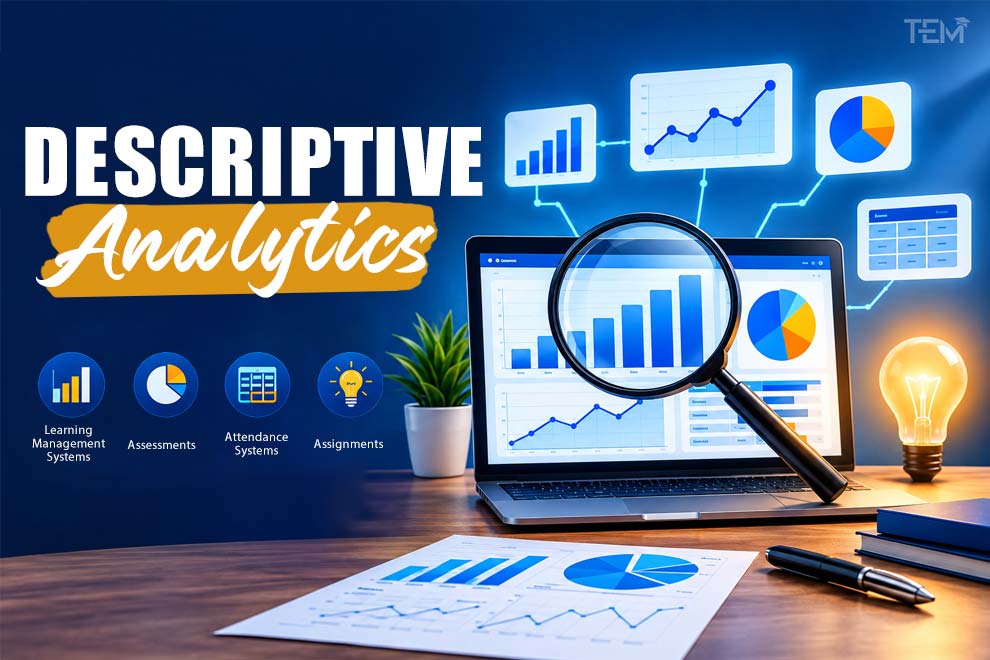
A high school science teacher notices that assignment completion dropped sharply in Week 6. Quiz scores dipped by 15 percent across two class periods, and average time spent inside the online learning portal decreased significantly. Is this a guarantee that students will fail the upcoming final exam? Not at all. It is descriptive analytics doing its primary job: showing the teacher exactly what changed.
In modern digital classrooms, student interactions leave behind hundreds of data points every single week. Raw data alone is overwhelming. Descriptive analytics organizes these raw interaction logs into structured evidence, turning individual activity records into visible patterns. Instead of relying on guesswork or waiting for end-of-term grades, educators can use descriptive reports to ask better, more targeted questions about classroom learning.
What Is Descriptive Analytics?
Descriptive analytics is the process of organizing, aggregating, and summarizing historical data to show what happened. In education, it converts attendance records, assessment scores, learning portal activity, and assignment submissions into clear reports, dashboards, and visual trends that help educators understand student and course activity.
Descriptive analytics in education measures and aggregates historical student interaction data to answer a single fundamental question: what happened in the learning environment? According to the Society for Learning Analytics Research (SoLAR), descriptive analytics aggregates data to reveal trends from past performance.
It does not attempt to explain why an event occurred or predict future results. Instead, as highlighted in research guidelines from the Institute of Education Sciences (IES), descriptive analysis identifies patterns in data to address questions about who, what, where, when, and to what extent. It provides a clear, reliable snapshot of historical performance so educators, administrators, and students can evaluate real progress.
How Does Descriptive Analytics Work?
Descriptive analytics turns raw educational activity into readable insights through a structured process.
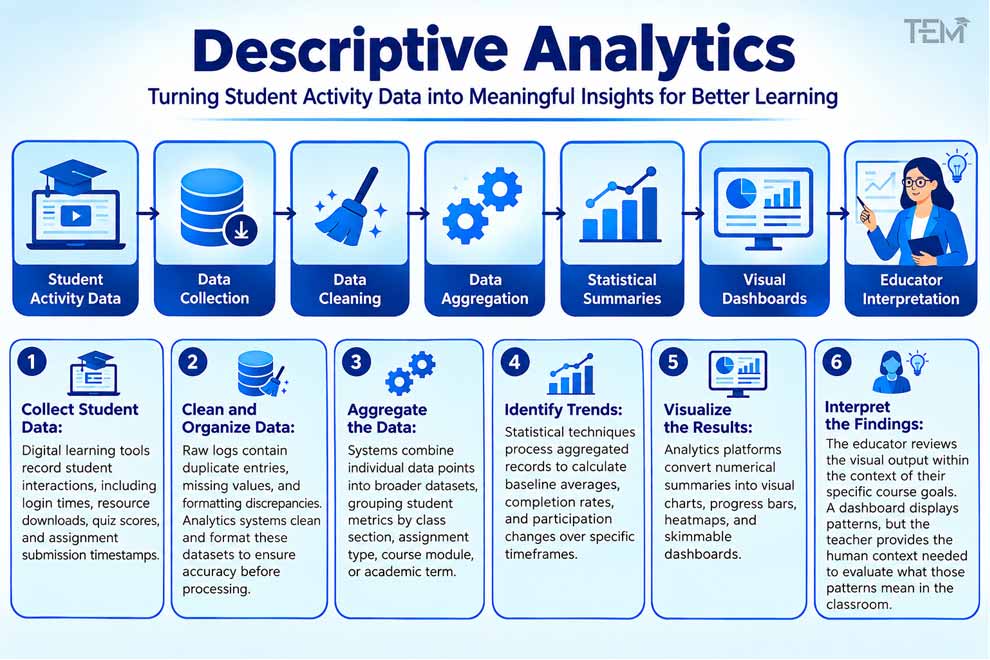
- Collect Student Data: Digital learning tools record student interactions, including login times, resource downloads, quiz scores, and assignment submission timestamps.
- Clean and Organize Data: Raw logs contain duplicate entries, missing values, and formatting discrepancies. Analytics systems clean and format these datasets to ensure accuracy before processing.
- Aggregate the Data: Systems combine individual data points into broader datasets, grouping student metrics by class section, assignment type, course module, or academic term.
- Identify Trends: Statistical techniques process aggregated records to calculate baseline averages, completion rates, and participation changes over specific timeframes.
- Visualize the Results: Analytics platforms convert numerical summaries into visual charts, progress bars, heatmaps, and skimmable dashboards.
- Interpret the Findings: The educator reviews the visual output within the context of their specific course goals. A dashboard displays patterns, but the teacher provides the human context needed to evaluate what those patterns mean in the classroom.
What Data Does Descriptive Analytics Use in Education?
Educational analytics relies on multiple streams of historical data to construct accurate summaries of student engagement and academic progress.
| Data Source | Example Metrics Collected | Educational Purpose |
| Learning Management Systems | Logins, session durations, page view counts | Measures course engagement and access consistency. |
| Assessments | Formative quiz scores, question error rates, attempt histories | Identifies mastery levels and specific skill gaps. |
| Attendance Systems | Present, absent, and tardy records | Tracks physical and virtual participation consistency. |
| Assignments | Submission timestamps, draft logs, completion rates | Measures pacing, workload management, and completion trends. |
| Discussion Forums | Post counts, reply thread depth, peer interaction counts | Evaluates social collaboration and peer learning levels. |
| Video Platforms | Rewind frequency, playback speed, video completion rates | Highlights content clarity and media engagement. |
| Surveys & Feedback | Rating scales, course evaluations, self-reports | Captures student perceptions and satisfaction trends. |
Descriptive Analytics Techniques
Descriptive analytics relies on specific statistical and data processing techniques to summarize educational metrics.
- Frequency Distribution: Counts how often a specific event or score occurs, such as how many students earned an A, B, or C on a midterm exam.
- Percentages and Proportions: Converts raw counts into standardized ratios, such as the percentage of the class that submitted an assignment on time.
- Measures of Central Tendency: Calculates the mean, median, and mode to represent baseline performance across a class or cohort.
- Minimum and Maximum Ranges: Identifies the highest and lowest scores to show the spread and variability of student performance.
- Trend Analysis: Tracks performance or engagement changes across weeks, units, or academic years.
- Cohort Analysis: Compares specific groups of students, such as comparing first-year student completion rates against second-year students.
- Data Aggregation: Combines thousands of micro-level clickstreams into macro-level summary statistics.
- Exploratory Data Analysis and Visualization: Converts complex numerical matrices into line graphs, bar charts, and color-coded dashboards for rapid visual scanning.
Descriptive Analytics Examples in Education
Real-world education projects show how descriptive analytics can turn historical student and course data into understandable patterns. The following examples are based on documented implementations rather than hypothetical classroom scenarios.
1. University of Michigan: MyLA Student Learning Dashboard
The University of Michigan developed My Learning Analytics (MyLA), a student-facing dashboard that presents information about engagement with course materials, resources, assignments, and grades. The dashboard uses visualizations to help students see patterns in their learning activity and academic performance. MyLA draws on learner activity data stored in the Unizin Data Platform and has been used or piloted at multiple institutions.
What it demonstrates: Descriptive analytics can summarize course engagement and performance data into visual information that helps students understand what has already happened in their learning.
2. San Bernardino City Unified School District: Data Dashboards
San Bernardino City Unified School District (SBCUSD) in California implemented a near-real-time data dashboard alongside a structured Data Analysis Protocol to help educators and school leaders examine education data. The National Center for Education Statistics documents how the district uses these approaches to make data more accessible and support discussions about teaching and learning.
The district’s approach illustrates how education data can be organized into dashboards and analyzed to determine how outcomes have changed, rather than relying solely on isolated records or static reports.
What it demonstrates: At the K–12 level, descriptive analytics can bring multiple education metrics together so educators can identify changes and patterns across students, classrooms, and schools.
3. University of Florida: Descriptive Learning Analytics Dashboard
Researchers at the University of Florida tested a descriptive learner-facing dashboard in an online statistics course. The dashboard showed students their actual performance, including the percentage of questions they answered correctly in a module. Researchers compared this descriptive dashboard with a separate predictive dashboard that estimated the probability of receiving a particular final grade.
This example clearly illustrates the difference between the two approaches: the descriptive dashboard reported what had already happened, while the predictive dashboard attempted to estimate what might happen next.
What it demonstrates: Descriptive analytics can present historical performance without turning the information into a prediction about a student’s future outcome.
How Teachers Use Descriptive Analytics
Instructors use descriptive analytics as an operational tool to monitor, refine, and plan instruction.
- Monitoring Participation: Teachers track daily logins, discussion posts, and resource accesses to ensure students remain active.
- Reviewing Assessment Item Analytics: Item-level breakdowns highlight specific questions that most students answered incorrectly.
- Evaluating Course Pacing: Completion timelines show whether students are keeping up with weekly reading loads or falling behind.
- Comparing Class Cohorts: Teachers compare engagement levels between morning and afternoon sections to adjust teaching delivery.
- Improving Future Instructional Design: End-of-course activity reports highlight which modules generated the highest engagement and where students spent the most time.
Teacher Insight: A number is a signal, not an explanation. A 40 percent drop in portal activity might mean students are disengaged, but it could also mean the teacher assigned an offline group project. Context always matters.
How Students Can Benefit From Descriptive Analytics
Descriptive analytics is not just for instructors. Student-facing dashboards help learners manage their own academic progress.
- Personal Progress Dashboards: Students view their completed assignments, current grades, and upcoming deadlines in one central interface.
- Study-Time Insights: Visual logs show students how many hours they spent inside course modules each week, encouraging better study habits.
- Self-Reflection Benchmarks: Comparing personal submission pacing against class averages helps students reflect on their self-regulation skills.
Descriptive Analytics vs Diagnostic, Predictive & Prescriptive Analytics
The SoLAR framework organizes learning analytics into four progressive methodologies. Each addresses a different question and serves a distinct function.
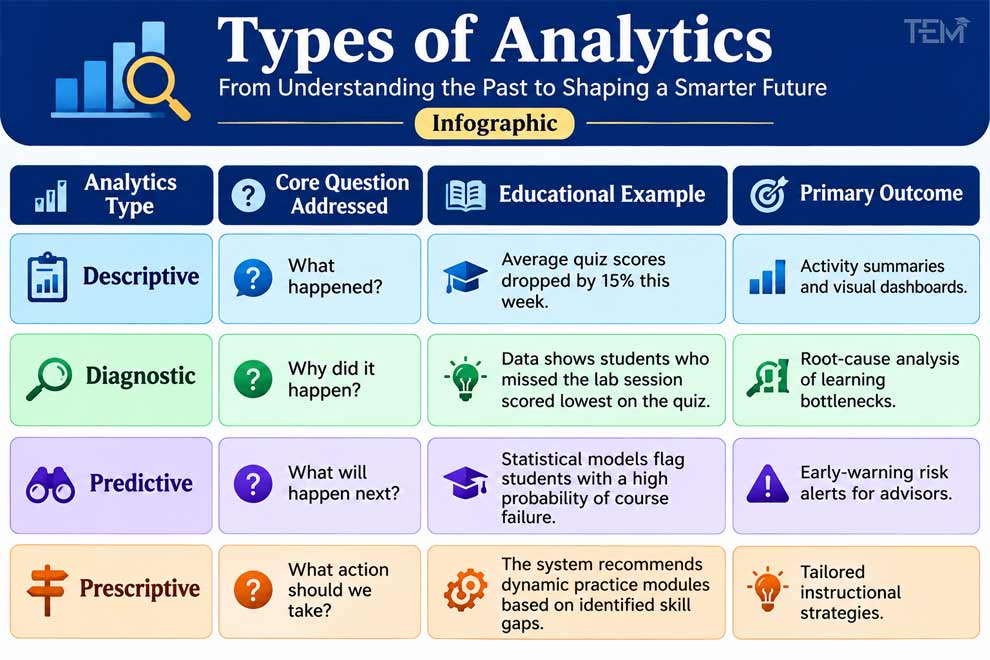
Descriptive analytics provides the essential starting point for all advanced analytics. You cannot diagnose or predict future student outcomes without first establishing what has already occurred.
Descriptive Analytics vs Descriptive Statistics
While these terms sound similar, they serve different scopes in educational technology.
- Descriptive Statistics: Refers strictly to mathematical calculations used to summarize a specific dataset, such as calculating the mean, median, standard deviation, or percentage.
- Descriptive Analytics: A broader operational discipline that combines descriptive statistics, data cleaning, data aggregation, interactive visual dashboards, automated reporting, and user interface tools to present ongoing trends to non-technical users.
Descriptive Analytics vs Learning Analytics
Understanding how descriptive analytics fits into the broader field of learning analytics prevents conceptual confusion.
| Aspect | Descriptive Analytics | Learning Analytics |
| Definition | A specific analytical methodology focused on historical summaries. | An interdisciplinary field combining education, human design, and computer science. |
| Primary Scope | Answers what happened using past interaction logs. | Covers descriptive, diagnostic, predictive, and prescriptive methodologies. |
| Final Output | Visual charts, activity reports, and summary dashboards. | Actionable teaching interventions, personalized learning, and course optimization. |
For a full breakdown of the broader field, explore our comprehensive guide on Learning Analytics in 2026: Turning Student Data Into Better Learning.
Technology Stack Behind Descriptive Analytics
Rather than relying on a single tool, educational institutions use an integrated technology stack to gather and present descriptive metrics.
- Learning Management Systems (LMS): Native reporting tools in Canvas, Moodle, Blackboard, and D2L Brightspace track logins, assignment completions, and score averages.
- Business Intelligence (BI) & Visualization Platforms: Tools like Microsoft Power BI and Tableau aggregate institutional metrics into interactive visual dashboards.
- Data Analysis & Query Tools: Analysts use Microsoft Excel, Python (Pandas), and R to run custom frequency distributions and statistical summaries on exported student logs.
- Student Information Systems (SIS): Central administrative software like Ellucian and Workday Student stores historical grade transcripts, attendance logs, and enrollment demographics.
- Learning Record Stores (LRS): Systems using xAPI and Caliper Analytics capture informal learning activities across external apps, simulations, and eBooks.
Descriptive Analytics Dashboards: What Should Educators See?
An effective educational dashboard focuses on clarity and relevance rather than cluttering the screen with unnecessary charts.
- Engagement Metrics: Active student counts, average portal session durations, and unread forum posts.
- Performance Metrics: Class score distributions, highest and lowest quiz averages, and item-level error rates.
- Participation Metrics: On-time assignment submission ratios and virtual session attendance logs.
- Course Trends: Week-over-week completion changes and resource view heatmaps.
Dashboard Rule: A good dashboard is not about displaying more data. A good dashboard displays relevant data that an educator can understand in 30 seconds.
Benefits of Descriptive Analytics in Education
Implementing descriptive analytics delivers clear operational advantages for schools and universities.
- Simplifies Complex Data: Converts thousands of raw clickstream logs into intuitive visual graphs.
- Increases Classroom Visibility: Gives teachers clear insight into how students interact with digital resources.
- Supports Evidence-Based Teaching: Replaces instructional assumptions with verified performance metrics.
- Highlights Content Issues: Quickly exposes confusing reading assignments, broken links, or flawed quiz items.
- Facilitates Communication: Provides clear, factual reports for parent conferences, advising check-ins, and department reviews.
- Creates an Analytical Foundation: Serves as the required first step before implementing predictive early-warning tools.
Limitations of Descriptive Analytics
While descriptive analytics is valuable, institutions must understand what it cannot do.
- Cannot Prove Causation: A descriptive report shows that attendance dropped, but it cannot explain if the drop was caused by illness, difficult material, or bad scheduling.
- Cannot Predict Future Performance On Its Own: Past activity indicates trends, but descriptive data alone does not project future student grades.
- Misses Offline Learning: Reading physical textbooks, studying in peer groups, or offline reflection are not recorded by digital analytics tools.
- Cannot Measure Motivation: Clicks and log-in times measure activity, not a student’s internal focus or enthusiasm.
- Requires Human Interpretation: Without teacher review, raw statistical summaries can lead to incorrect conclusions.
Privacy & Ethical Considerations
Collecting student activity logs requires strict compliance with privacy standards and ethical data governance.
- Data Minimization: Schools should collect only the student metrics necessary to support instructional goals.
- Transparency: Students and parents must receive clear disclosures detailing what data is logged and who has permission to view it.
- Access Controls: Role-based permissions must restrict student records to authorized teachers and advisors in compliance with FERPA and GDPR laws.
- Avoiding Misinterpretation: Administrators must train staff to treat descriptive summaries as starting points for conversation rather than final judgments on student capability.
The Role of AI in Descriptive Analytics in 2026
Artificial intelligence enhances descriptive analytics by simplifying how educators query and summarize complex datasets.
- Automated Dashboard Summaries: AI models analyze weekly class performance logs and generate plain-language written summaries for teachers.
- Conversational Data Queries: Instructors can ask natural-language questions like “Which quiz had the lowest completion rate this month?” and receive immediate visual reports.
- Anomaly Detection: Machine learning algorithms flag unusual activity drops automatically, saving teachers from manually sifting through spreadsheets.
Even with AI automation, human context remains essential. AI can generate a summary, but educators must decide how to respond to their students.
How to Implement Descriptive Analytics in a School or University
Institutions implementing descriptive analytics should follow a structured, seven-step approach.
- Define the Educational Question: Identify what you want to understand, such as course completion rates or student resource usage.
- Select Relevant Data Sources: Choose the software platforms (LMS, SIS, assessment portals) that store the necessary activity logs.
- Verify Data Quality: Clean datasets to ensure records are accurate, complete, and free of duplicates.
- Choose Meaningful Metrics: Focus on primary performance indicators like attendance, submission pacing, and assessment averages.
- Build Visual Dashboards: Design skimmable visual reports tailored to teachers, advisors, and students.
- Train Educators: Provide staff development on how to interpret visual dashboards within the context of their teaching.
- Evaluate and Iterate: Review analytics usage regularly to confirm that reporting tools support better instructional decisions.
Future of Descriptive Analytics in Education (2026–2030)
Looking toward 2030, descriptive analytics will become more real-time, personalized, and integrated into daily learning workflows.
- Natural-Language Interfaces: Static tables will be replaced by conversational reporting tools that explain trends in plain English.
- Multimodal Data Capture: Future platforms will integrate physical classroom interaction data, voice engagement metrics, and digital clickstreams into unified summaries.
- Privacy-Preserving Learner Summaries: Advanced synthetic data techniques will allow researchers to evaluate historical trends without risking exposure of personal student identities.
Key Takeaways
- Answers “What Happened?”Descriptive analytics organizes past interaction logs into clear summaries, trends, and reports.
- Foundational Layer: It serves as the essential first step before diagnostic, predictive, or prescriptive analytics can occur.
- Empowers Educators: Helps teachers monitor participation, evaluate test fairness, and adjust instructional pacing based on evidence.
- Requires Context: A dashboard displays activity trends, but human educators must interpret what those trends mean in the classroom.
- Focuses on Privacy: Responsible implementation mandates clear data transparency, strict access controls, and data minimization.
FAQ
- What are common examples of descriptive analytics in schools?
Common examples include class attendance reports, assignment completion rate charts, average quiz score summaries, and LMS portal login trackers. These tools help teachers monitor student engagement across a semester.
- Why is descriptive analytics important for teachers?
It replaces intuition with factual classroom evidence. Teachers can quickly see which topics students struggle with, track assignment completion, evaluate test fairness, and adjust upcoming lesson plans based on real learning data.
- Can descriptive analytics explain why a student failed?
No. Descriptive analytics identifies that a score or completion rate dropped, but it cannot explain the root cause. Uncovering why an event happened requires diagnostic analysis and direct conversation between the teacher and student.
- What tools are used to create descriptive analytics reports?
Schools use Learning Management System analytics (Canvas, Moodle, Blackboard), Business Intelligence platforms (Power BI, Tableau), Student Information Systems, and spreadsheet software like Excel.